Restart
This is a spacefilling view of an atomic model for MeCP2 bound to
DNA containing a CpG motif. A spacefilling view shows all atoms at
their Van der Waals radii. Thus it is good for showing the
surface shapes and how molecules in a complex fit together: it is less
good at showing the stereochemistry of amino-acids,and it is also
difficult to identify particular amino-acids. By convention atoms are
usually shown in the following colours:
Nitrogen(Blue);Oxygen(red); Carbon (grey); Sulphur (yellow); and
Phosphorous(Orange). In the view here, the DNA has been coloured
yellow, to differentiate it from the protein. The phosphorous atoms are
shown in orange so that you can follow the shape of the DNA
chains. Hold-down the left mouse button and then drag the mouse to
rotate the molecule. Hold down shift key and drag up and down
with left
mouse button depressed to change the zoom.If
you get you hoplessly lost after rotating the molecule, clicking on the
x will restore the initial view.
[Close]
DNA
This shows DNA as a wireframe object. The carbon atoms ahve been
changed from the default colour, grey, to yellow os that you can
differentiate the DNA from protein. In this view the stereochemistry
of the molecule is more easily seen. Bases and the phosphate
back-bone are more easily identified.You can click the Xs in any order,
so you can toggle betwen space-filling and wireframe representations of
the DNA by clicking the last X and this one alternatively.
[Close]
Show Methyl Cytosine
This view highlights the two DNA bases that are methyl cytosines
in pink.Click the previous X and this one to toggle this colour on and
off. [Close]
Show Protein Backbone
This view shows the protein backbone. A stick is drawn between
alpha-Carbon atoms. The chain is colour-coded to show the N-terminus in
blue and the carboxy terminus as red. Residues in between follow the
intervening colours of the rainbow so that the trace of the amino-acid
sequence can be followed through the structure.
[Close]
Show Protein Cartoon
This view shows a cartoon of the protein structure.
Beta-strands are shown as arrows, pointing from N-terminus towards the
C-terminus. Alpha-helices are shown as coiled ribbons. Those parts that
have neither secondary structure are shown as smooth curves that follow
the protein backbone. [Close]
R133
This view shows Arginine 133 as a stick model. The carbon atoms
are shown in green in order to differentiate the residue from the rest
of the protein, which is shown as a grey backbone.This residue is
mutated to cysteine in the MeCP2 genes of some Rett's patients.
[Close]
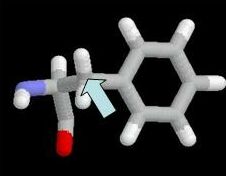
F155
This view shows F155.as a stick model. The carbon atoms are shown
in green in order to differentiate the
residue from the rest of the protein, which is shown as a grey
backbone.This residue is mutated to serine in the MeCP2 genes of some
Rett's patients.
[Close]
the atom name is shown below.
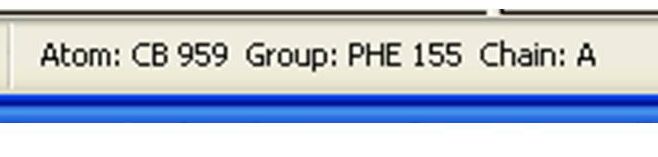
The atom name in this case is "CB". Ignore the number 959 (this just
tells us that it is the 959'th atom in the structure). "PHE" tells us
that it is a phenylalanine residue ( number 155 in the sequence).
"Chain A", tells us that it is chain A. In the assessed problem,
the atom name you would return is "CB".
[Close]
R 133 Mutation - Measuring Distances
This view highlights shows Arginine 133 highlighted in
with green carbon atoms. DNA carbon atoms that are close to R133 are
shown in purple to help you limit your search for atoms that are within
contact distance of R133 hydrogen atoms that you were asked to identify
in the previous question. The mouse has been set so that when you click
any two atoms in succession, the distance is given in Angstroms in the
lower left frame of your browser window. For example, if you hit the
two atoms in phenylalanine highlighted below
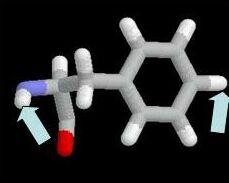
The lower left of the browser frame would show
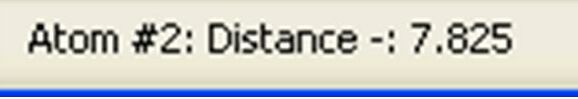
The distance in this case is 7.825 Angstroms.
.
[Close]
F 155 Mutation - Measuring Distances
This view highlights shows an Arginine residue.
[Close]
Set Mouse Identify
This view highlights shows an Arginine residue.
[Close]
Set Mouse Distance
This view highlights shows an Arginine residue.
[Close]
.
.
.
.
.
.
.
.
.
.
.