Nucleotide - Stick representation
A guanine nucleotide. The molecule is shown in a skeletal
representation, which shows its structural formula and sterochemistry well.
We use a convention here, called "CPK colours", to identify the atoms.
Carbons are grey; oxygens are red; nitrogens are blue; phosphates are orange.
The ribose units polymerise through their 5' phosphate
groups and 3' OH groups with other nucleotides to form a polynucleotide
backbone.
A disadvantage of the wireframe representation is that
it makes molecules look as if they are mostly empty space. In fact the
atoms are often tightly packed. Click the next x on the right-hand panel
to see the atoms at their full Van derWaals radii.
[Close]
Nucleotide -spacefilling
A guanine nucleotide, as shown by the previous button, is
represented with the atoms set to their Van derWaals radii. The atoms are
coloured: grey for carbons; red for oxygens; blue for nitrogens;phosphates
are orange. [Close]
Add a nucleotide to 3' OH
A cytosine nucleotide is shown condensed to the original
guanine nucleotide shown in the previous example. The link is between the
3'OH of the G base with the 5' phosphate of the C base, which forms the
new 3' end.
[Close]
Add another nucleotide to 3' OH
An adenine nucleotide is shown condensed to the original
guanine -cytosine dinucleotide shown in the previous example. The link
is between the 3'OH of the C base of the dinucleotide with the 5' phosphate
of the A base at the 3' end.
[Close]
Add another nucleotide to 5' OH
An adenine nucleotide is shown condensed to the guanine-cytosine-adenine
trinculeotide in the previous example. The link is between the 3'OH of
the adding A base with the 5' phosphate of the G base at the 5' end of
the trinculeotide.
[Close]
Add complementary strand
The polynucleotide in the last example ran from 5' at bottom
of the screem to 3' at the top. The complementary strand runs in the opposite
direction. Complementary bases pairs ( A:T and G:C) make hydrogen bonds.
[Close]
Show double stranded DNA
We show the double stranded, complementary base pairs as
shown in the cartoon before question 1. The single stranded overhang is
shown in the next image.
[Close]
Show double stranded DNA with single stranded
overhang
The single stranded, poly T, overhang is shown in addition
to the double stranded DNA.
[Close]
Show alpha helix
This purpose of this section is to help you to recognise
secondary structural elements, alpha helices and beta strands, and the
different ways in which they are sometimes represented. Here we show an
alpha helix in wireframe mode. Usually protein structure contain so many
atoms that it is difficult to understand them. That is why we use molecular
graphics to simply them and to display the molecule in different ways that
best fit our purpose. In the next section, we shall highlight the backbone,
which allows us to see the direction of the mainchain better.
[Close]
Show alpha helix backbone
In green we highlight the backbone ( ie amide nitrogen, alpha
carbon, carbonyl carbon, carbonyl oxygen). Note how the side-chains are
angled away from the helix. They have the appearance of an arrow-head that
points from N-terminus of the helix towards its C-terminus. In the next
image we simplify the structure even more by just drawing links between
the backbone alpha carbons. [Close]
Show alpha helix trace through alpha carbons
Here we show bonds that link alpha carbons. Of course, alpha
carbons are actually linked by two other backbone atoms. So bonds linking
alpha carbons are 'virtual' bonds. The value of this representation is
that it simplifies an alpha helix so that it is instantly recognisable.
The down side is that we lose information about which direction ( N-terminus
to C-terminus)the helix is running unless we click on atoms and find in
which direction the sequence runs. [Close]
Show beta strand - wireframe
This shows a beta strand in a wireframe representation. It
is fairly easy to see the backbone. Rotate the molecule about to appreciate
the 'pleated' nature of the backbone, as sidechain are found alternatively
on either side of the backbone. The next image highlights the backbone.
[Close]
Show beta strand - backbone
The backbone of the beta strand shown in the previous image
is highlighted in green.
[Close]
Show beta strand trace through alpha carbons
Here we show bonds that link alpha carbons. Of course, alpha
carbons are actually linked by two other backbone atoms. So bonds linking
alpha carbons are 'virtual' bonds. The value of this representation is
that it simplifies a beta strand so that it is instantly recognisable.
[Close]
Display Helicase: DNA; ATP form
Here we show a crystal structure of a helicase with bound
DNA with a single stranded overhang and bound ATP. If you have worked through
the previous sections, you will find recognise DNA and the single stranded
overhang. The protein is shown as a trace through the alpha carbons. It
folds into four domains. These are all part of the same chain but form
distinct globular regions of the protein. They have been coloured green
for domain 1a and red for domain 2a. ATP, shown as a spacefilling model,
is found in a cleft between these two domains. The blue and yellow domains
bind the double stranded region of the DNA. The single stranded DNA binds
across the tops of the red and green domains.
[Close]
Display Helicase: DNA; ATP form
Here the phosphate form of the helicase complex. The colour
scheme is the same as the previous image. The difference is that phosphate,
not ATP, is found in the cleft between the green and red domains. Also,
the single stranded DNA has moved. We show its position in the phosphate
structure in magenta. For comparison we leave its former position in the
ATP structure, as in the last image.
[Close]
Display ssDNA before and after hydrolysis of ATP.
Position of single stranded DNA before hydrolysis of DNA
is shown with carbon atoms in grey. The position of the same polynucleotide
after ATP is hydrolysed is shown with carbons in magenta. You will see
that the phosphate groups almost overlap at the 3'OH of the ss DNA in the
ATP form ( grey carbons) and the penultimate phosphate of the ss DNA after
ATP hydrolysis ( purple atoms).Your task is to measure the distance between
phosphate groups at the ends of both chains. You do this by clicking each
in turn. The distance is displayed in Angstoms at the bottom of the frame
that encompasses your browser. An example is given below for a distance
that measures 13.508 Angstroms ( not the correct answer!).
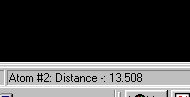
[Close]
Toggle between ATP and Phosphate Structures.
Hit the X button to toggle between structures of the
helicase with bound ATP or bound phosphate. You can tell which is
which by the labelled molecule in the cleft between the red and green
domains. Phe 64 and Tyr 257 are shown as green, spacefilling
molecules. These change position relative to each other when the red
and green domains undergo a conformation change when ATP is hydrolysed.
Double stranded DNA and the single stranded overhang are shown for
both conformations for reference. The changed position of the ssDNA
in the phosphate structure is highlighted by showing its carbons in magenta.
.
[Close]
Display conserved motifs.
The ATP structure is shown. The trace through the alpha
carbon co-ordinates is shown in white. The seven regions in the
sequence that are found to be similar in a number of different
helicases, even if the organisms are distantly related, are
highlighted in colour: region I (cyan); region Ia (magenta); region II
(blue); region III (orange); region IV(red); region V (yellow); region
VI (green)
.
[Close]
.
.
.
.
.
.
.
.
.
.
.